|
|
 |
Sea Surface Temperature (SST)
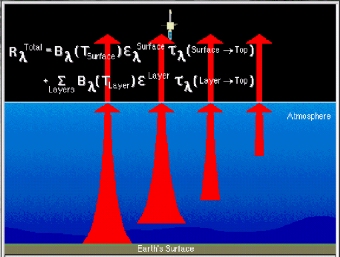
Sea surface temperature (SST) is another surface property we are interested
in from a meteorological perspective. An IR window in the atmosphere for
sensing surface temperature is the 10-12mm
region where absorption by water vapor is weak. However, for accurate SST the emission by the atmosphere must be accounted for in the retrieval.
The following figure is a MODerate
resolution Imaging Spectrometer (MODIS) 11mm
image that clearly indicates changes of SST in the vicinity of the Gulf
Stream. Most of the radiation in this band is emitted by the surface and
transmitted through the atmosphere. In a warm moist atmosphere the difference
between the SST and the brightness temperature at 11mm
(BT11) can approach 10°
C. This difference is often corrected for by making observations at more
than one wavelength, such as 11, 12, 3.7 and 8.5mm.
Differences between these channels represent the total amount of water
vapor in the column. For example, the 12mm
channel has more absorption and therefore (BT11-BT12}
is positive; the greater this difference the larger the water vapor loading
of the atmosphere. Observations at these wavelengths are used daily to
derive SST. The SST from satellite observations is typically determined
from a regression derived empirically using observations from drifting
buoys.
Back
Return to Lesson 4
Return to Satellite Meteorology Main Page
|

