|
|
 |
Lesson 4: Heat Island
Remote Sensing Urban Heat Islands using Weather Satellites

It has been known for some time that cities
are generally warmer than the surrounding, more rural areas. Because
of this relative warmth, a city may be referred to as an urban heat island.
The reason the city is warmer than the country comes down to a
difference between the energy gains and losses of each region.
There are a number of factors that contribute to the relative
warmth of cities:
- During the day in rural areas, the solar energy absorbed near
the ground evaporates water from the vegetation and soil. Thus,
while there is a net solar energy gain, this is compensated to
some degree by evaporative cooling.
In cities, where there is less vegetation, the buildings, streets
and sidewalks absorb the majority of solar energy input.
- Because the city has less water, runoff is greater in the
cities because the pavements are largely nonporous (except by the
pot holes). Thus, evaporative cooling is less which contributes to
the higher air temperatures.
- Waste heat from city buildings, cars and trains is another factor
contributing to the warm cities. Heat generated by these objects
eventually makes its way into the atmosphere. This heat contribution can be as much
as one-third of that received from solar energy.
- The thermal properties of buildings add heat to the air by
conduction. Tar, asphalt,
brick and concrete are better conductors of heat than the vegetation
of the rural area.
- The canyon structure that tall buildings create enhances the warming.
During the day, solar energy is trapped by multiple reflections
off the buildings while the infrared
heat losses are reduced by absorption.
- The urban heat island effects can also be reduced by weather phenomona. The temperature difference between the city and surrounding
areas is also a function of the synoptic scale
winds. Strong winds reduce the temperature contrast by mixing
together the city and rural air.
- The urban heat island may also increase cloudiness and precipitation
in the city, as a thermal circulation sets
up between the city and surrounding region.
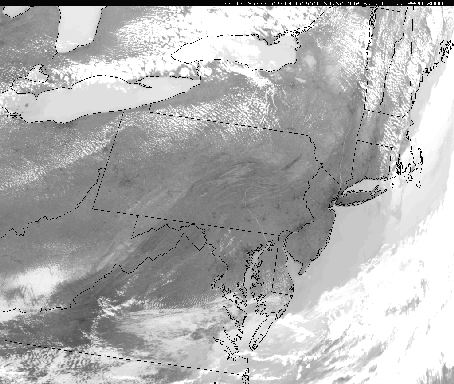
The urban heat island is clearly evident in a statistical study
of surface air temperatures. It is also apparent
on cloud-free satellite images, as the above 11 micrometer image produced
with the Advanced Very High Resolution Radiometer (AVHRR) shows.
The image has a spatial resolution of approximately 1 km. At this
wavelength, the AVHRR measures
the amount of radiant energy emitted by the surface and the tops
of clouds, which is proportional to the temperature of the emitting
body. The warmer the body, the greater the amount of radiant energy
it emits. White portions of the image represent cold objects (e.g.,
cloud tops) and dark regions are warm areas.
Use this applet to test your knowledge of geography using urban heat island identification. In this applet, a map is overlain the image to help orient you to the geography
of the region. You will be asked to find certain cities and geographic regions in the Northeast.
In the above AVHRR image, notice that on this day in April, the land is warmer (it appears darker in the image) than the Great Lakes and the Atlantic Ocean.
Urban heat islands appear on the image as "dark blemishes."
Back
Return to Lesson 4
Return to Satellite Meteorology Main Page
|


