|
|
 |
Lesson 4: Water Vapor Imagery
Water vapor imagery is a valuable tool for weather analysis and forecasting,
because it represents flow patterns of the upper troposphere.
Water vapor is transparent to radiation at visible and 10-12 micron
wavelengths. This is why visible and IR satellite imagery are used to observe
surface features and clouds. However, water vapor is a very efficient absorber
and emitter of radiation with wavelengths between 6.5 and 6.9 microns.
So, satellite radiometers measuring the amount of radiation emitted by
the atmosphere at these wavelengths can be used to detect water vapor in
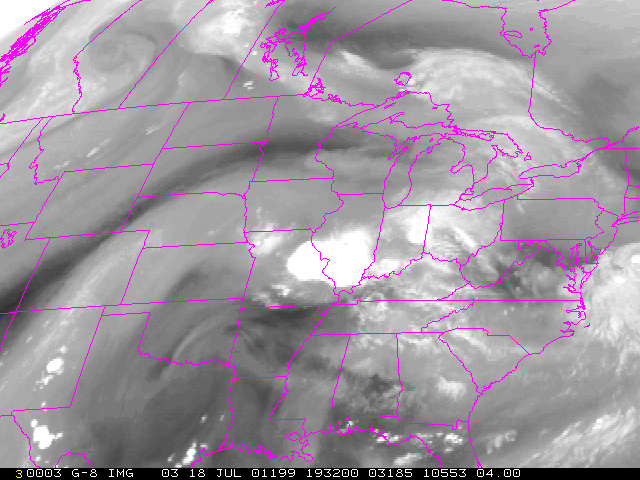
the atmosphere. The water vapor satellite image displays the water vapor
concentration in the atmospheric layer between 200 and 500 mb. Black indicates
low amounts of water vapor and milky white indicates high concentrations.
Bright white regions correspond to cirrus clouds. In the middle latitude
regions, zones with strong contrast in the amount of water vapor often
indicate the presence of a jet stream.

Click here to see an applet allowing fading between the visible, infrared, and water vapor images
Return to Lesson 4
Return to Satellite Meteorology Main Page
|


