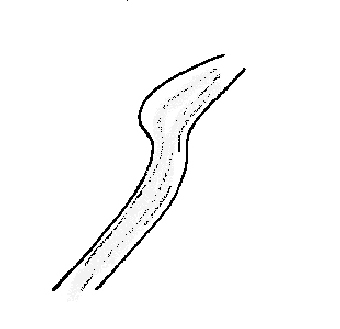
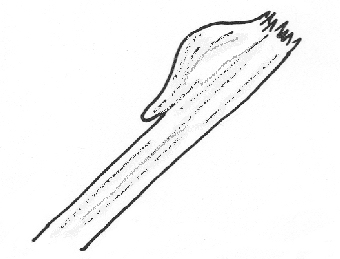
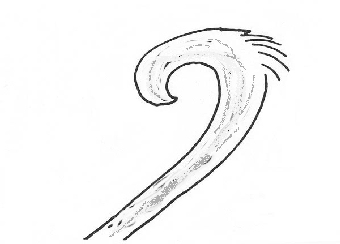
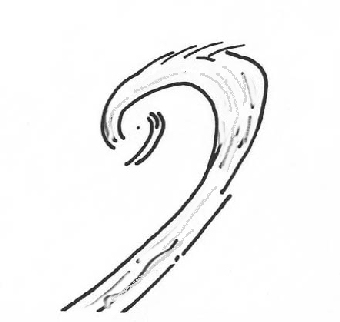
Lesson 1
Meteorological Satellite Orbits
Lesson 2
Review of Radiative Transfer
Lesson 3
Visible Image Interpretation
Lesson 4
Infrared Image Interpretation
Lesson 5
Multispectral Image Interpretation
Lesson 6
Fires & Aerosols
Lesson 7
Winds
Lesson 8
Sounders
Lesson 9
Fog and Stratus
Lesson 10
Thunderstorm
Lesson 11
Energy Budget
Lesson 12
Hurricanes
Lesson 13
Global Circulation
Lesson 14
Synoptic Scale
Lesson 15
Local Circulation
Lesson 16
Satellite Oceanography
Lesson 17
Precipitation

Lesson 14: Background

Surface Pressures Estimation from Synoptic Cloud Patterns

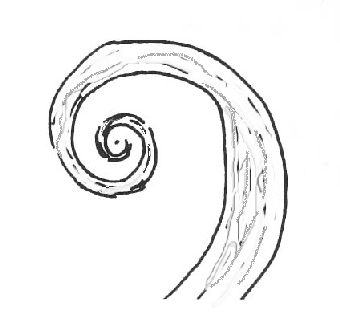
Surface pressure has been estimated from cloud patterns. Here are sketches of these cloud patterns and the associated pressure ranges(after Junker and Haller, 1980.) While the pressure may not be exact, you can you time sequences to estimate the rate of intensification of the storm.

Surface Press

Cloud Pattern

Surface pressure> 1000 mb

Image

990 - 999 mb

Note the beginnings of the dry slot.

Image

980's mb

Notice the emergence of a hooked pattern.

Image

Pressure is the 970's mb range when the cloud band is nearly wrapped once.

Image

Pressure is near 960 when the cloud band wraps around the center more than once.

Image


Return to Lesson 14

Return to Satellite Meteorology Main Page
AOS Main Page
Current Madison Weather
CIMSS GOES Gallery