|  | LESSON 7: SCALE OF ATMOSPHERIC CIRCULATIONS
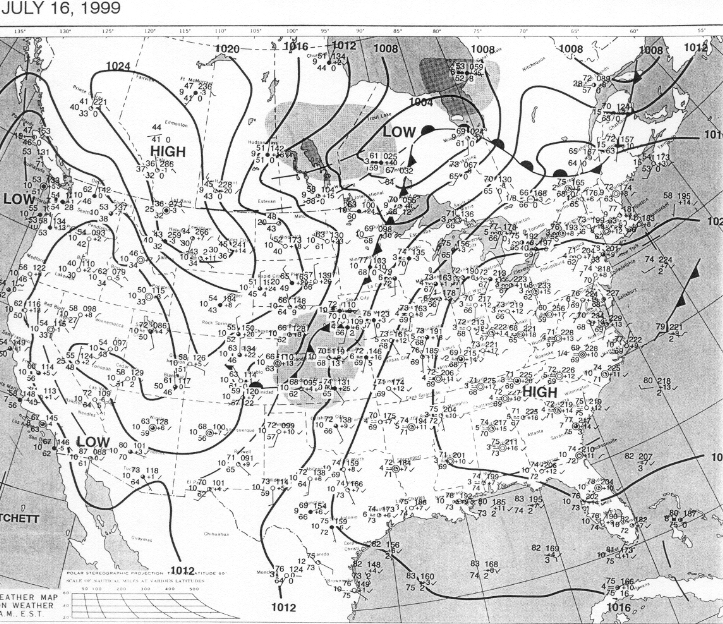
A Case Study of High PressureWeather associated with high pressure systems are sometimes considered by weather enthusiasts as and boring, but highs can harbor potentially tragic weather conditions. Air in a high diverges at the surface which weakens temperature and humidity gradients by spreading out the lines of constant temperature and moisture. Diverging air at the surface in a high requires air to sink toward the surface from above. Sinking air warms adiabatically and dries out in a relative sense (Chapter 6). This makes highs stable and often cloudless. The cloudless weather in high pressure systems, or anticyclones, is usually welcome. However, the sinking air and lack of strong winds in a high traps air in the lower troposphere. If a high remains over a heavily populated region for more than a couple of days, it can trap and concentrate pollution from cars and industry. Pollution affects aviators because polluted air is much harder to see through than unpolluted air, even if both situations are cloudless. July 16, 1999 was a very polluted day in the northeastern United States. A week's worth of pollution from the Midwest and the East Coast found its way into the high's circulation and collected over New England and its coastline. Satellite pictures from July 16th show that the polluted air was much less transparent than cleaner air atplaces. The brownish area along the coast from New Jersey to Massachusetts indicates polluted air. [From www.nrlmry.navy.mil/aerosol/Case_studies/19990717_jfk/]. It was on this day that John F. Kennedy Jr. crashed while traveling from New York City area to Hyannis Port, Massachusetts.
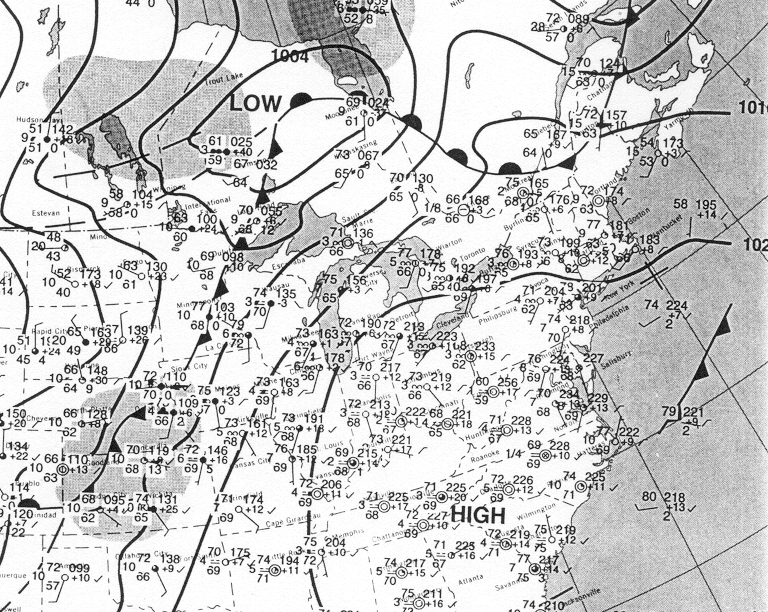
What was the likely explaination of the crash? The temperature inversion caused by the sinking motion in the anticyclone created a layer of extremely polluted air about 3000 feet above the ground over the Northeast. (See the haze and visibility observations associated with the high pressure system in the maps below) While the plane cruised at 5600 feet over Long Island Sound, visibilty was fine because the pollution was trapped below this altitude by the anticyclone. When the plane to approximately 3000 feet, visibility decreased immediately and drastically. Furthermore, the plane was over water, at night, and any lights or landmarks would have been blotted out by the pollution. At this point an experienced pilot would have navigated the plane using the instrument panel on the aircraft. Kennedy was not instrument qualified. Instead, he first tried to steer and climb out of the low-visibility pollution layer. This strategy didn't improve visibility. He likely became disoriented and inadvertently guided his plane into a fatal dive. Surface weather of the NE UW.
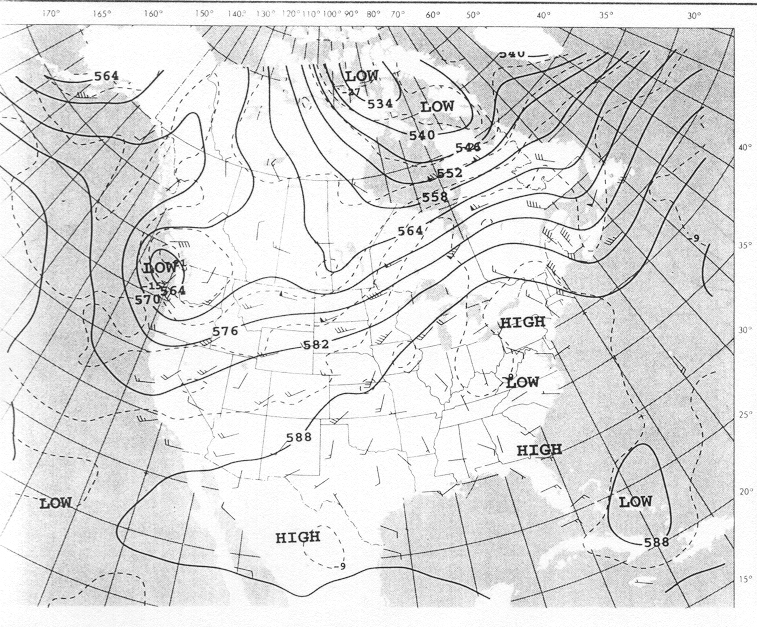
500 mb July 16, 1999
Return to Lesson 7 Page. Return to Weather For Pilots Main Page
|