CONTOURING II ASSIGNMENT (Map is at the bottom of the page)
Email
the answer to the following question. Note the question number in your answer and as a subject be sure to say 'Contouring II'.
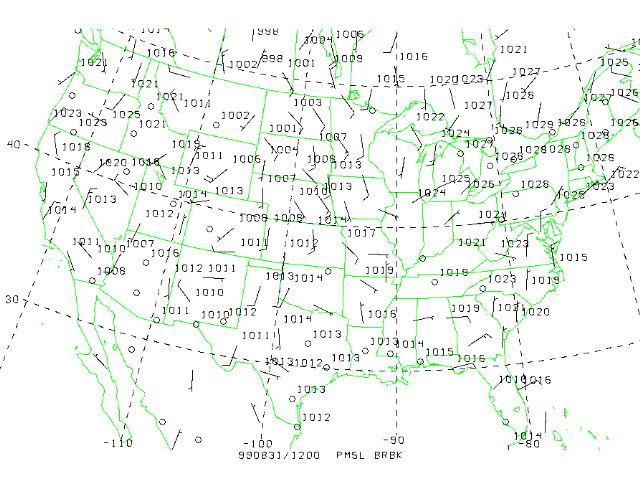
1. Indicate which state is reporting the lowest pressure.
2. Contour surface pressure (isobars) on the attached map,
using intervals of 4 mb centered on 1012 mb. You can use the java applet, or just print out the image and analyze it with a pencil.
Answer the following concept questions.
Concept Questions:
3. Looking at the isobars, name a state where it is
windy. How can you tell by looking only at the isobars and not
the wind barbs?
4. Looking at the isobars, name a state where it is
wind is calm.
Return to Lesson 3 Page
Return to Weather For Pilots Main Page
Local Madison Weather