All over the United States, hundreds of weather observations are taken
several times during the day. These stations collect information such as
temperature, pressure, dewpoint, etc. Meteorologists need a way to get all
of this detailed information into the smallest area possible on a weather
map, so that several stations can be plotted for the same observation
time on the same map, thus giving a big picture of what the weather is
doing at a snapshot in time. Thus the need for the station model. The
following exercise will show how to translate weather information to and
from a station model, and then you will both decode and encode station
models on your own.
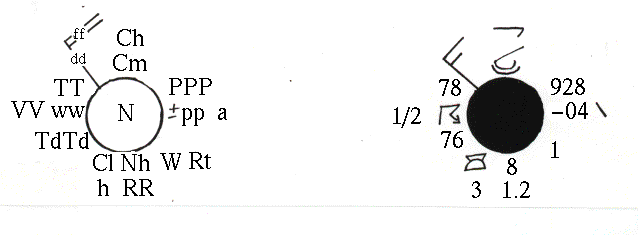
Symbol |
Example |
Represents |
KNOW THESE FIRST 10! |
|
N |
Total amount of cloud cover intenths |
10/10ths (overcast) |
dd |
Direction FROM which the wind is blowing |
Northwest |
ff |
Wind speed in knots (1 mph=1.1 knots) |
15 knots |
|
V V |
Visibility in miles |
1/2 mile |
|
ww Present Weather |
Thunderstorm |
|
PPP |
Sea Level Barometric pressure, in
millibars |
992.8 mb |
|
TT |
Current Air Temperature, in °
Fahrenheit |
78°
F |
|
TdTd |
Dewpoint
temperature, in °
Fahrenheit |
76°
F |
|
+pp |
Pressure change in the last 3
hours |
-0.4 mb |
|
a |
Characteristic of Barograph |
decreasing steadily |
| |
|
| |
|
|
LESS FREQUENTLY USED...
|
|
|
W |
Past weather |
Reqires a chart) |
|
Nh |
Fraction of sky covered by low
or middle clouds |
8 (=sky obscured) |
|
Cl |
Low clouds, requires
a chart |
Cumulonimbus |
|
Cm |
Middle clouds,
requires a chart |
Chaotic Sky (Ac) |
|
Ch |
High Clouds,
requires a chart |
Dense Cirrus (anvil) |
|
h |
Height of cloud base, requires a
chart |
3 (=600 to 999 ft) |
|
RR |
Amount of precipitation in
inches |
1.2 inches |
|
Rt |
Time precipitation
began or ended |
1 (=less than one hour ago) |