27 April 2011 Tornado Outbreak
On April 27, 2011 a cold front moved through the lower Mississippi valley. Ahead of the front, moisture from Gulf of Mexico flowed northward, combining with an upper level system to produce widespread severe weather. This system generated a tornado outbreak that affected much of the Southeast US. It was one of historic proportions, in terms of the number of strong to violent tornadoes produced and the number of resulting fatalities. The surface maps for the period 27 April 2011 are shown in the animation below for the following times: 12Z 18Z 21Z and 00Z on the 28th (or in eastern local time: 7 am, 1pm, 4 pm and 7 pm). Notice also the position of the dry line.
The 500 mb maps for 12Z on April 27 (7 am on April 27) and 00Z on April 28 (7 pm on April 27) are shown below. Notice the position of the trough and the location of the jet stream.
The 1-km resolution GOES-13 0.63 micron visible channel data (below) shows the multiple clusters of severe thunderstorms that developed across the region during the day.
With the higher 1-km spatial resolution of the POES AVHRR IR imagery (below), more detail could be seen in the cloud top IR brightness temperature structure, and much colder cloud top temperatures could be detected in the vicinity of the strongest overshooting tops (as cold as -83° C, violet color enhancement.)

POES AVHRR 12.0 µm IR image + SPC storm reports
Damage surveys from the Storm Prediction Center (SPC) of the National Weather Service (NWS) for April 26 and 27 (as of May 1, 2011) are seen in the images below.

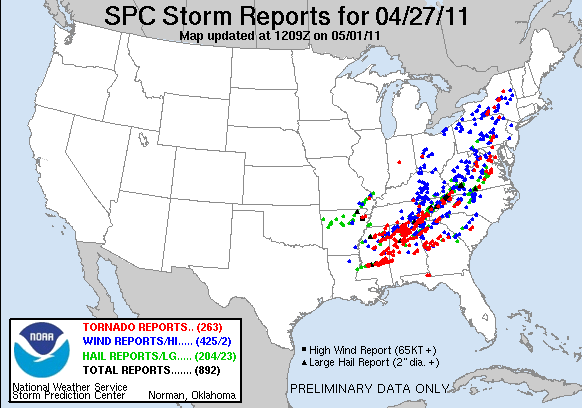
As of May 1, the NWS indicated that at least two of the tornadoes in the major outbreak of April 27 was given a preliminary rating of EF-5, and 11 with an EF4.
The National Weather Service preliminary (NWS) count of 288 tornadoes during the event from 8:00 am EDT April 26 to 8:00 am April 28 was nearly double the previous record event of 148 tornadoes on April 3-4, 1974.
The death toll of at least 340 people during the 24-hour-period from 8:00 a.m. Wednesday to Thursday, the largest of any tornado event in the modern warning era of radar and satellite imaging. The Tuscaloosa-Birmingham tornado during the April 2011 event caused at least 65 fatalities. This tornado had a maximum width of 1.5 miles and a track 80 miles long. During the 24-hour period from 8:00 a.m. EDT April 27 to 8:00 a.m. EDT April 28, The NWS estimated there were a total of 312 tornadoes. The NWS issued warnings for more than 90 percent of these tornadoes, with an average lead-time of 24 minutes.
Some of the tornadoes were large enough and caused enough damage that their paths could be seen in satellite images. Below is a visible image from the Terra MODIS satellite instrument on late morning on April 29th, showing the damage paths clearly through central Alabama.
Some tornado damage paths across northern Alabama are also evident in an image of the 1-km resolution MODIS Land Surface Temperature (LST) product (below). The LST values within the damage paths were in the low to middle 80s F (darker red color enhancement), compared to surrounding LST values in the upper 70s F (orange color enhancement), indicating that the damage paths with destroyed vegetation and tornado debris were able to heat up a few degrees more than the adjacent undisturbed vegetation. The urban areas of the cities of Tuscaloosa (KTCL) and Birmingham (KBHM) also exhibited warmer LST values (darker red) than the surrounding less urbanized, more densely forested areas. This urban heat island is discussed in Chapter 15.
Example Radar images
A National Weather Service survey team determined that an EF3 tornado with winds of 150 MPH occurred in Dade and Walker Counties. The image below, from the NWS, shows the path length in Georgia (the tornado tracked into Georgia from Alabama)was 18 miles with a width of six tenths of a mile. There were 2 fatalities and 12 injuries with this storm.

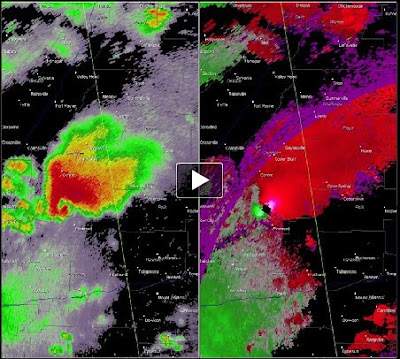
As we discussed in this chapter, Doppler radar can be used to detect tornado signatures in storms. In the images below, you can fade between the reflectivity and the storm relative velocity radar images to locate the tornado.
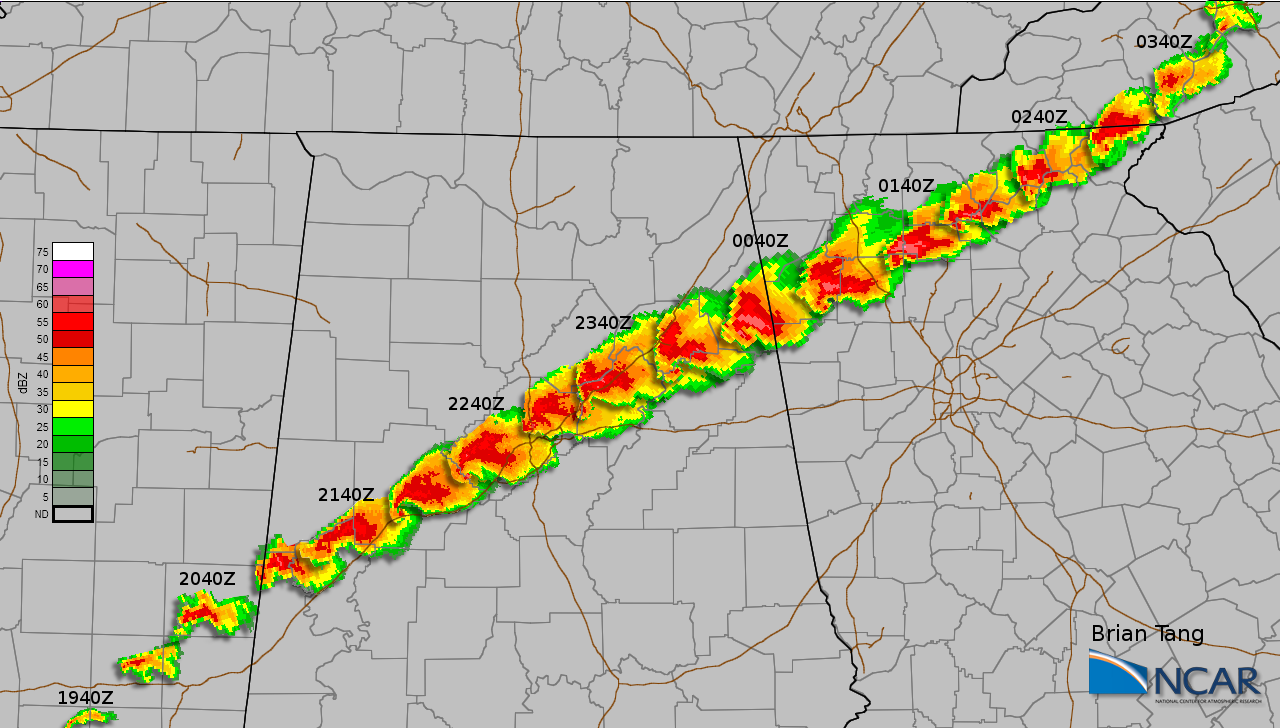
Brian Tang (while at National Center for Atmospheric Research)composited this sequence of radar base reflectivity images of a supercell that spawned a tornado that may have stayed on the ground for the 60 miles from Tuscaloosa to Burmingham. Look for the tornado signatures in this montage of radar images.
Victor Gensini (while a Ph.D. student at University of Georgia) composited the following sequence of radar images of a supercell that originated in Mississippi and decayed in North Carolina. The radar base reflectivity is shown on the left, and storm-relative velocity on the right. As Victor points out, it is important to keep in mind that he is tracking the storm, so as the storm is moving the altitude at which the radar beam is sampling the storm is constantly changing (getting higher as the storm moves further away from a particular radar).
And finally - here are some before and after images of the tornado passage in Tuscaloosa (move the slider bar in the middle of the image) provided by NOAA (after photo) and Google Earth (the before image).